Mumps Network Time Series Example
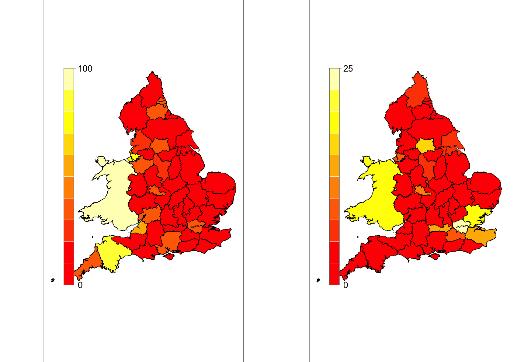
The figure below shows the number of cases of Mumps measured in counties of England and Wales during the first and last week of 2005 as part of a larger set containing data for every week in this year. This data was kindly supplied by Daniela DeAngelis and Douglas Harding of the UK Health Protection Agency. In this form it is a multivariate time series.
However, we know that counties are linked. For example, what happens in Somerset might influence what happens in Devon, much more than what happens in Yorkshire (for example). Hence, we can endow the multivariate time series with a network structure such as the one in then next figure.
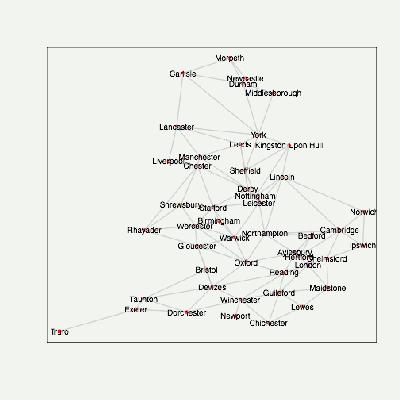
This network structure can be used to provide interesting new time series models for the data, to detrend it effectively, decorrelate (similar to network inspired principal components analysis) and to aid with forecasting the evolution of the disease.
|