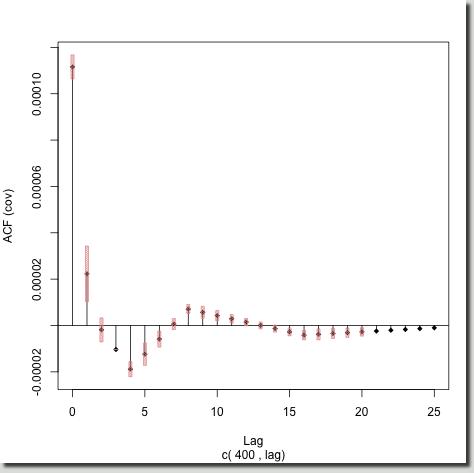
The right plot shows the local autocovariances for time 400.
Here, the lag one autocovariance's confidence interval does not overlap zero and hence we can conclude that the lag one autocovariance IS significantly different from zero, and actually the same is true for the lag four, five, six and some of the higher lags
Conclusion
Hopefully, this page and its examples will have convinced you of the usefulness of localized autocovariance and autocorrelation. If you have tested your time series for stationarity and it rejects stationarity then the localized tools above could be appropriate for, and give you insight into your data.
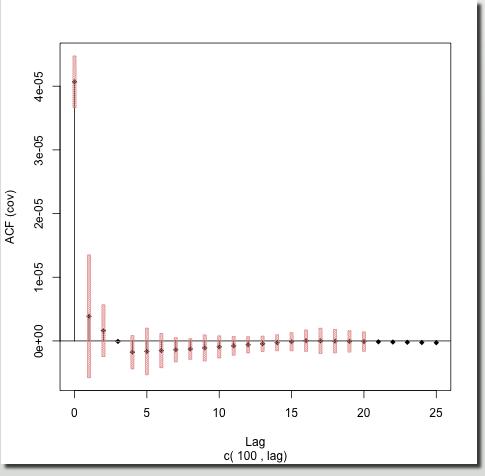
The localized autocovariances and their confidence intervals are produced using the Rvarlacv function in the locits package in R.
|