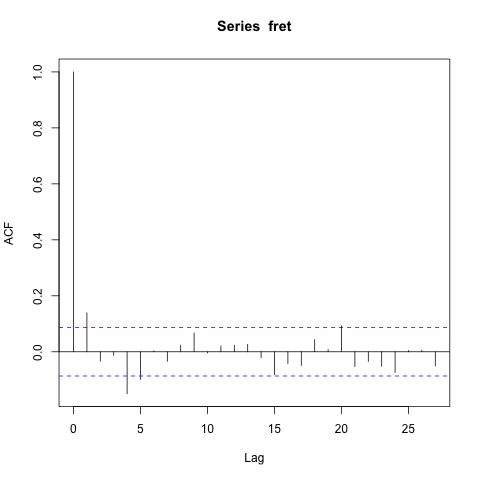
FTSE Autocorrelation
The figure above shows the autocorrelations associated with the FTSE time series plot above. Apart from the lag zero value, which we know is always one all of the other autocorrelation values are small.
The plotted autocorrelations are empirical and computed from a data set of 512 observations. One can postulate a stationary statistical model underlying the FTSE data set which permits one to conceive of a `true' or underlying autocorrelation function which the empirical values estimate. Using such a model one can use some mathematical theory to show that the two parallel dotted blue lines in the above autocorrelation plots are approximate 95% intervals. For the FTSE autocorrelation plot at least four of the acfs appear outside of the confidence intervals suggesting that at least maybe some of the `true' autocorrelations are not zero.
We now look at the dual of the autocovariance, the spectrum.
Spectrum...
|