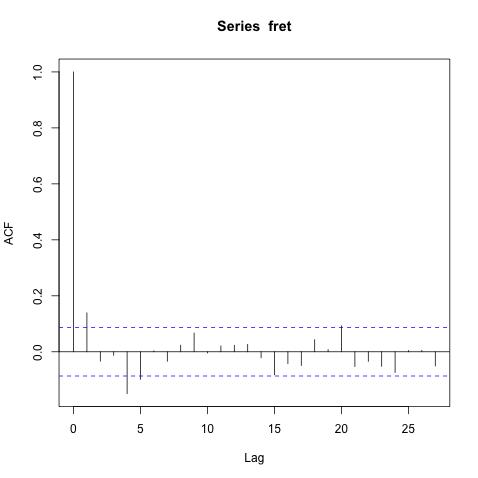
Maybe FTSE returns are not stationary?
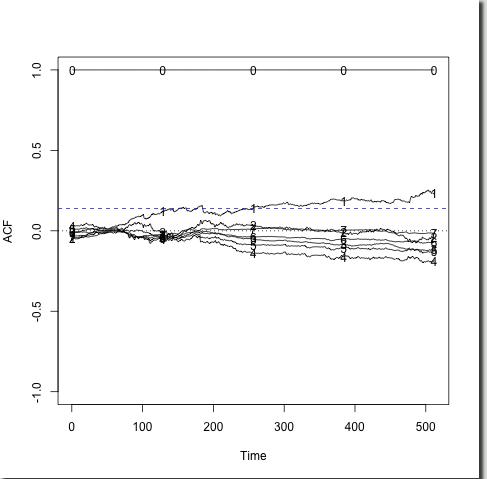
For an alternative explanation the right picture shows the localized autocorrelation plotted against time. What is interesting is that the localized autocorrelation at lag one for the FTSE series starts off very close to zero, and then steadily climbs to about 0.2 In fact, if you averaged all of the localized autocorrelation values over time you would end up with a value not far from 0.139 which is demonstrated by the horizontal dashed blue line which is located at the middle (in height) of the two extreme values of 0 and 0.2. So, the regular autocorrelation averages out the localized autocorrelation.
This kind of plot is direct evidence that the FTSE returns are not stationary.
More on local FTSE autocorrelation>
|